01
End-to-end managed
We handle data setup, pipelines, dashboard design, QA, publishing, and maintenance.
02
Tableau-powered
Interactive dashboards on an enterprise-grade BI platform your team can use without code.
03
Your data, secure
Your reporting environment is private, access-controlled, and separated from other clients.
04
Scales with you
Start with the essentials, then add departments, sources, and custom reporting as you grow.
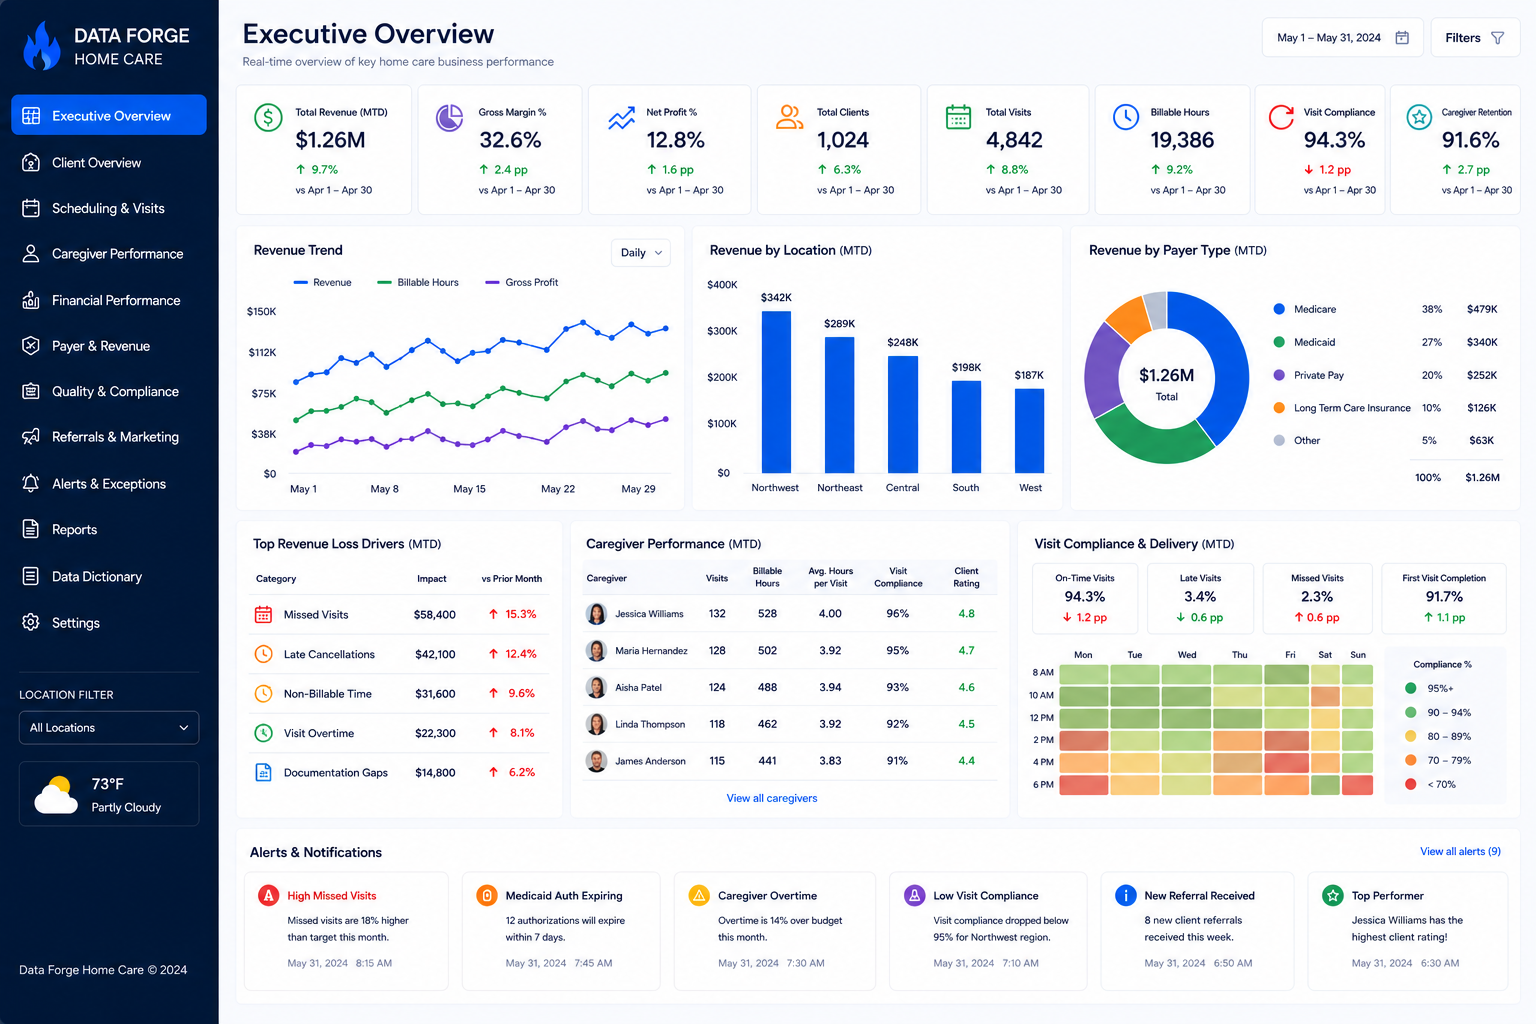
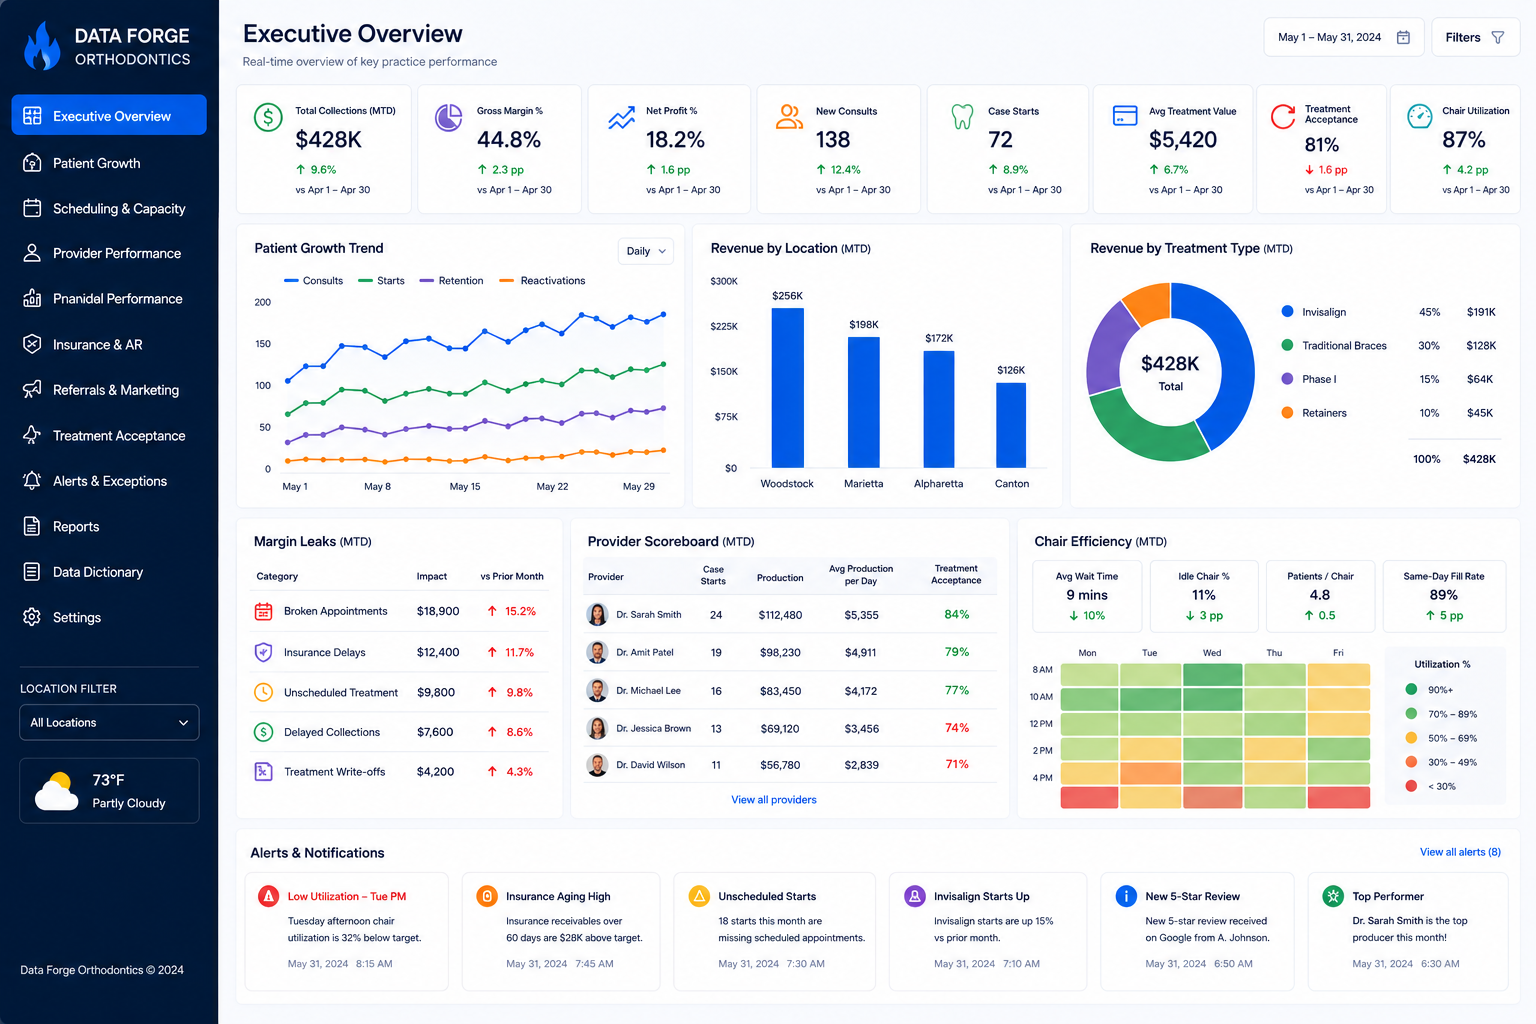
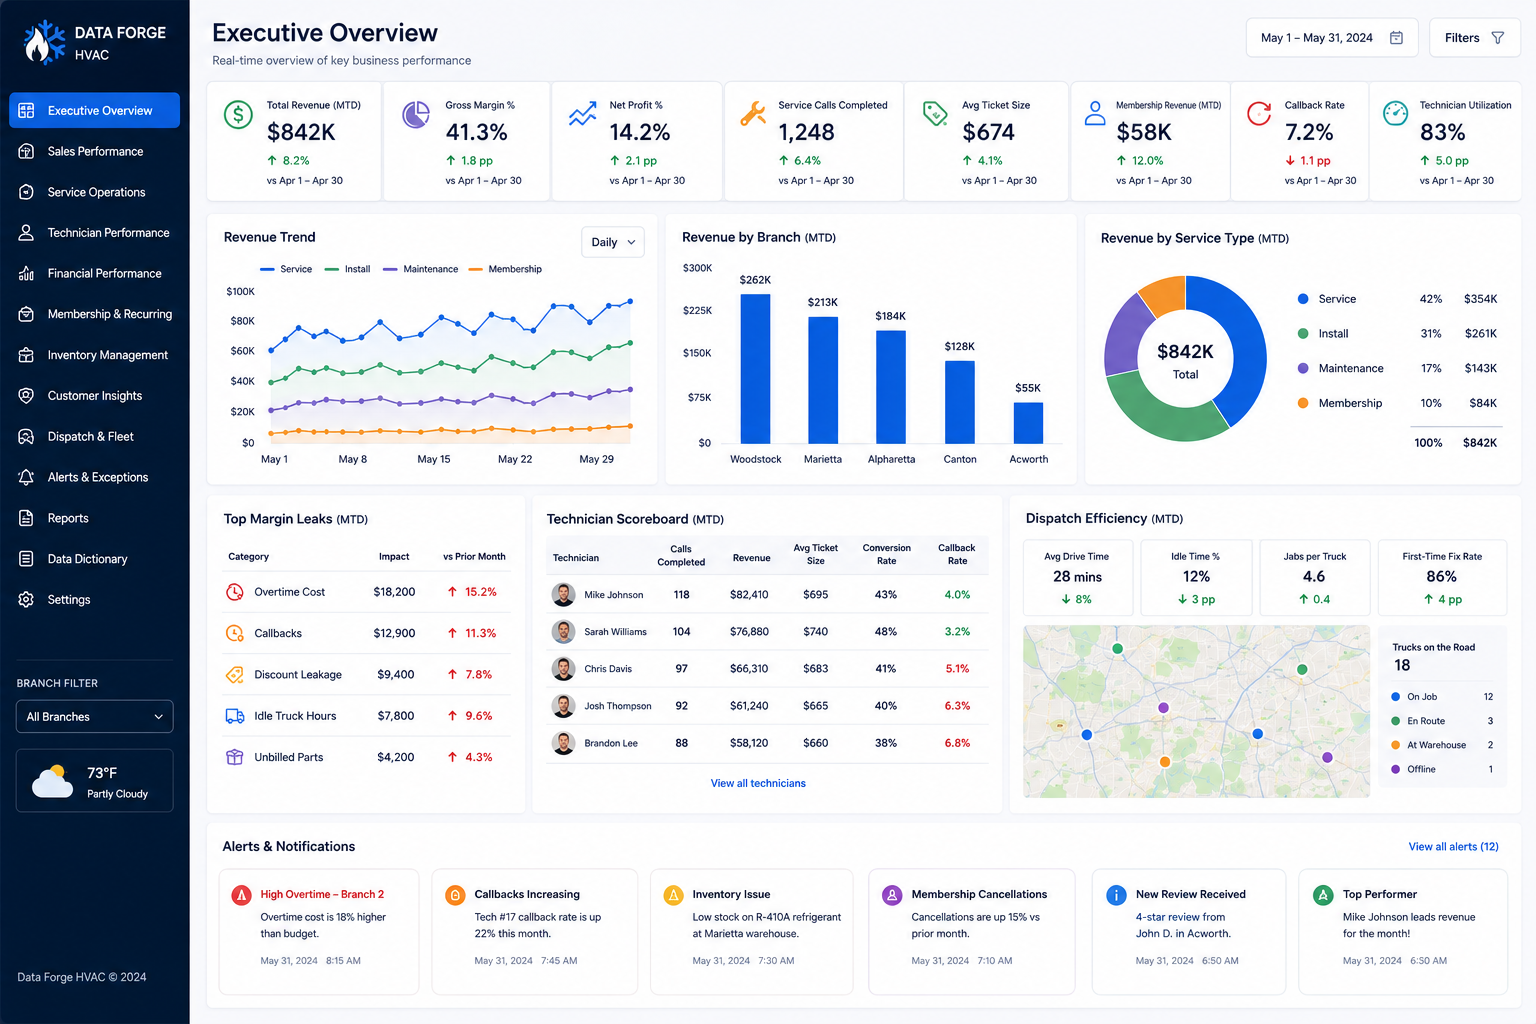
Dashboard 01
Executive Overview
Revenue trends, gross profit, EBITDA, cash balance, locations, and top-level KPIs in one leadership view.
RevenueCash FlowKPIsLocations
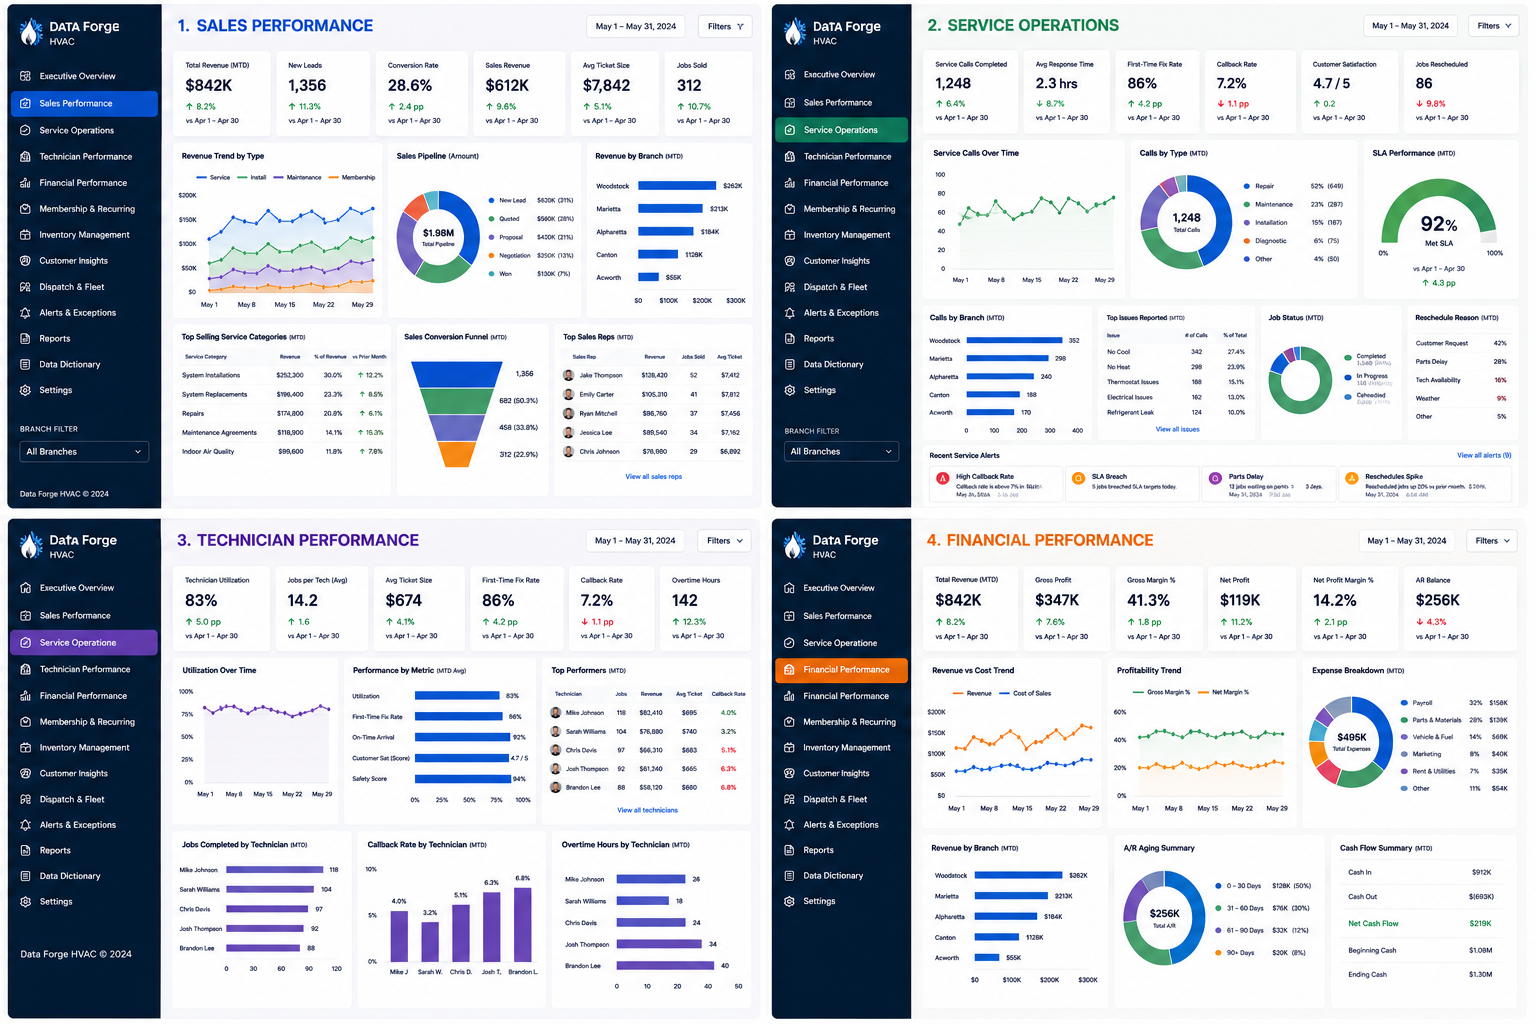
Dashboard 02
Sales Performance
Pipeline, win rates, deal sizes, rep performance, source trends, and forecast visibility.
PipelineWin RatesRepsForecasting
Dashboard 03
Operations
Job completion, on-time performance, backlog, capacity, team productivity, and service bottlenecks.
JobsCapacityBacklogTeam
Dashboard 04
Financial Performance
P&L visibility, actual vs budget, expenses by category, margin trends, and cash flow waterfall.
P&LBudget vs ActualExpensesCash Flow